Maximize Limited Patrol & Analyst Resources for Highest Impact
Automate Directed Patrol Planning to Better Serve Communities
Request A Consultation
THE CHALLENGE FOR LAW ENFORCEMENT
All across the United States, agencies are being pushed to their limit in the wake of understaffing and high crime levels. Given this combination of circumstances, it’s more important than ever before that patrol, task force, and crime analyst resources are used efficiently. But many agencies are currently spending far too much time and effort manually producing hotspot analysis reports to direct officers where to go, which can result in quickly outdated and low-impact patrol plans with unintentional under- and over-policing, and little visibility into officer activity. This can erode community goodwill and leave departments more vulnerable to criticism.

IMPROVE EFFICIENCY AND EFFECTIVENESS
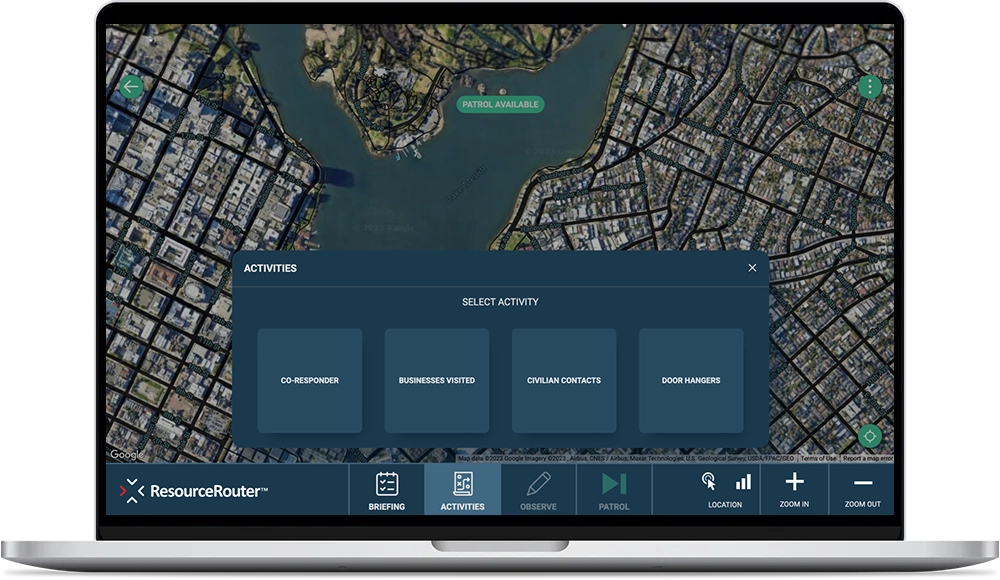
ResourceRouter (formerly ShotSpotter Connect) is a patrol and analyst tool that automates the planning of directed patrols for all Part 1 crime data across an entire jurisdiction, daily. With ResourceRouter, analysts and supervisors review pre-generated directed patrol assignments that ensure officers are at the right place at the right time to maximize crime prevention while also guarding against over and under policing. Pre-patrol briefings provide situational awareness to officers and recommend patrol tactics, facilitating optimal outcomes even with limited staffing and resources.
[ResourceRouter] has to be one of the biggest bang-for-the-buck policing tools around. It makes our patrol and analyst operations more impactful across the whole jurisdiction at a time when it’s a challenge to protect and serve due to staffing shortages.
Unlike traditional manual hotspot analysis reporting, which is time consuming to produce, often relies on months-old data, and casts too wide a net in its direction of patrol units, ResourceRouter’s automated directed patrols are precise and produced daily, by shift and beat, across the jurisdiction. As a result, crime analysts spend far less time conducting manual analysis each week, by as much as 80%, freeing up bandwidth to focus on value-added investigative and strategic activities.
I can tell you unequivocally that we would not be able to achieve what [ResourceRouter] allows us to do with directed patrols with the resources we have in terms of the number of analysts and the time that would require.
*ShotSpotter Connect was rebranded to ResourceRouter in April 2023.
With ResourceRouter, line-level supervisors and command staff can gain comprehensive insight into how patrol officers are spending time on shifts, easily assess officer compliance, continuously evolve best practices based on a data-driven approach, and report on patrolling metrics with greater accuracy and transparency.
-
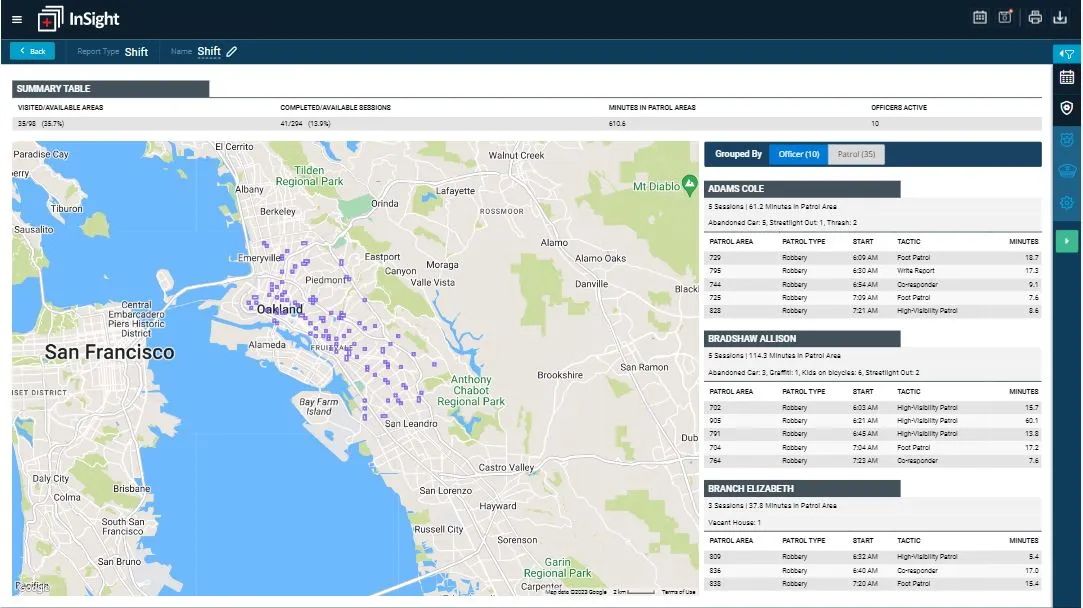
The Shift Report shows where officers were and what they were doing over time.
-
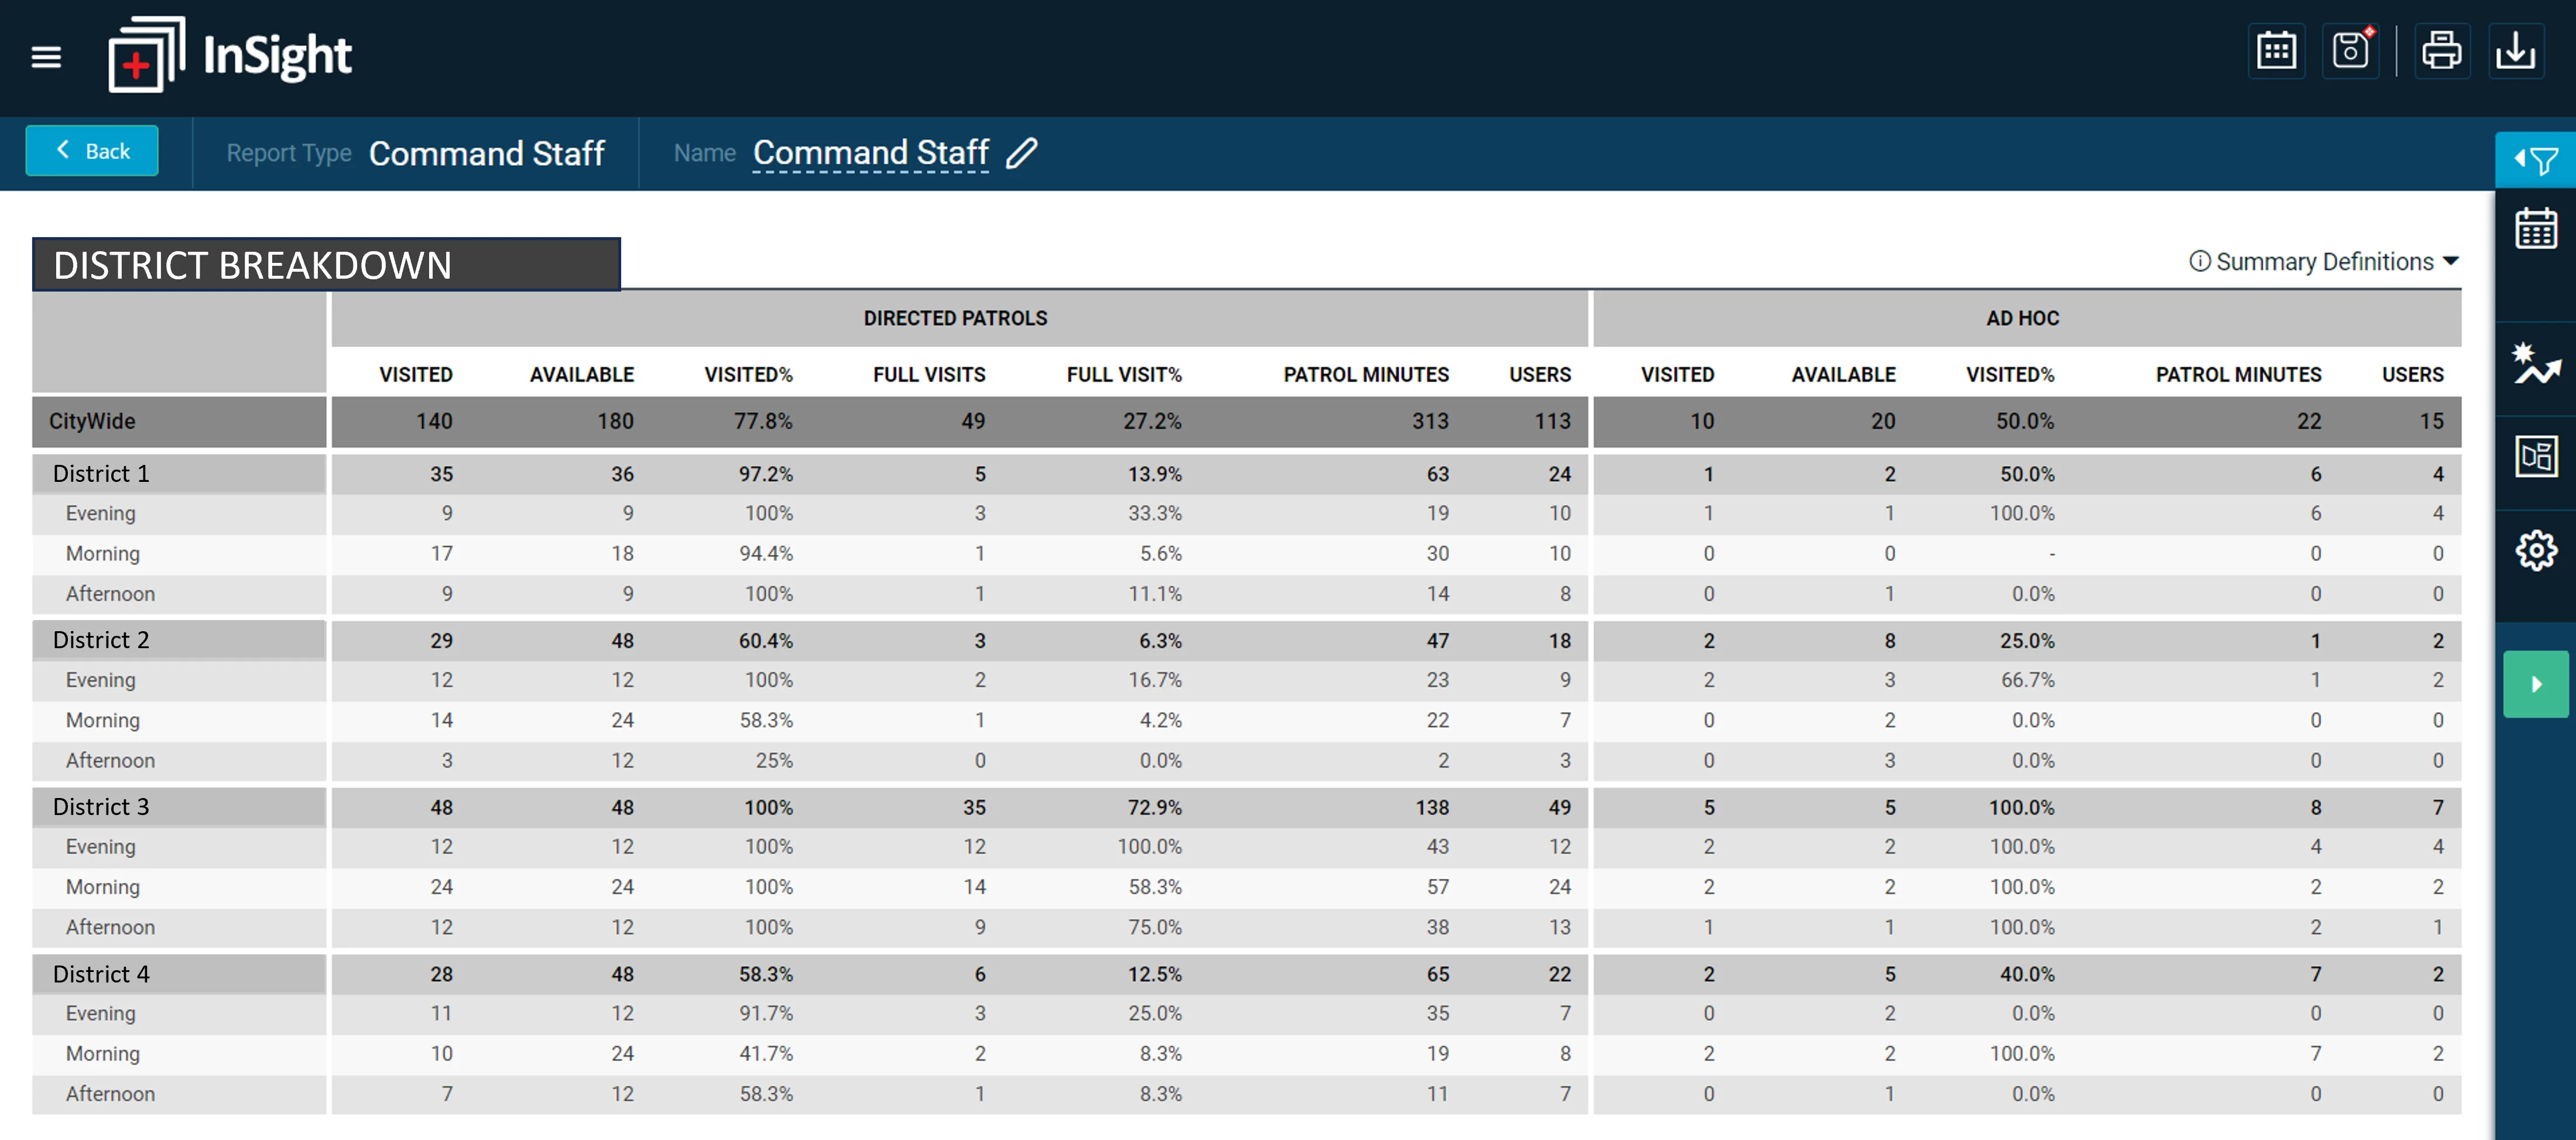
The Command Staff Report provides comparison metrics for directed patrol activity by area, risk forecast, and shift.
-
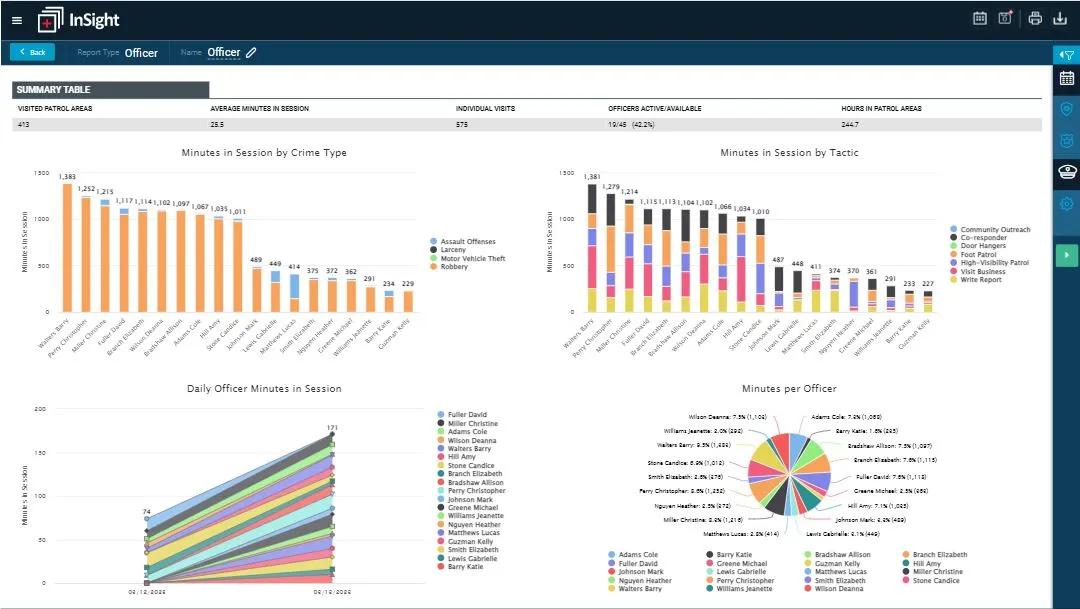
The Officer Report shows how time was spent on each tactic to hold officers accountable.
-
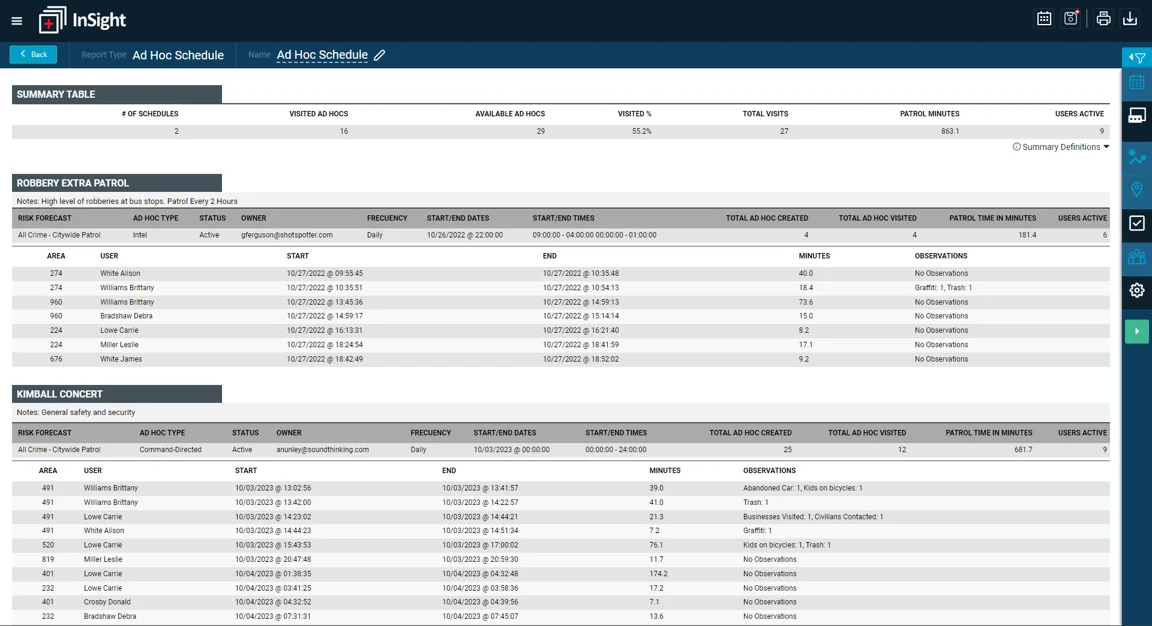
The Ad Hoc Schedule Report allows agencies to see officer activity for agency defined events such as a special auto theft detail or weekend parade event.
-
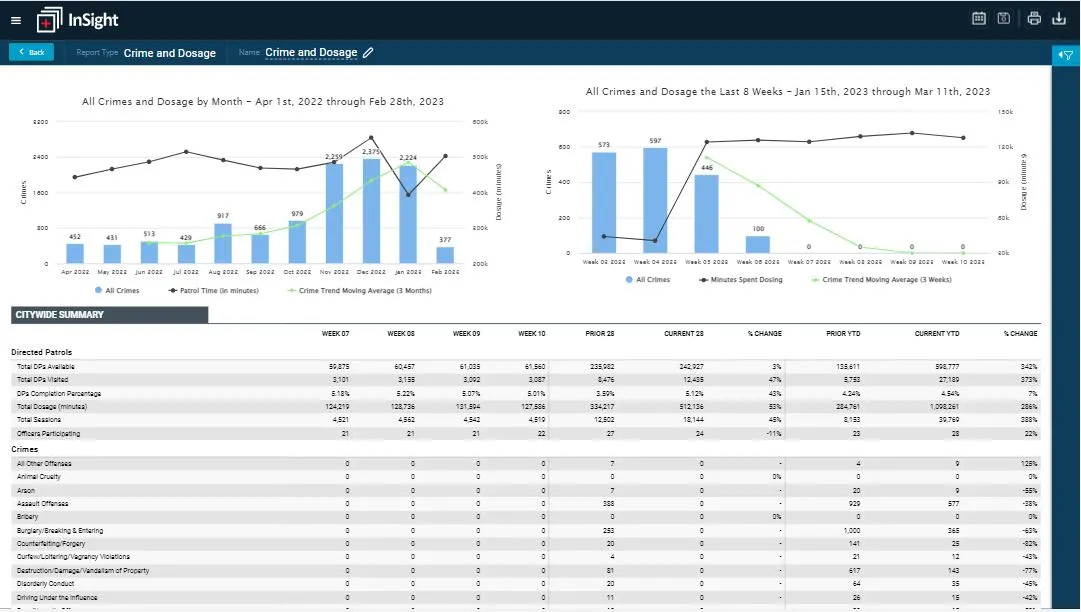
Title Crime and Dosage Report illustrates how directed patrols are impacting crime over time.
With ResourceRouter, agencies are better able to direct officers to where they are needed most, ultimately reducing patrol gaps while building community trust and confidence. “People feel safer because they’re seeing officers on the street,” said South Bend Assistant Police Chief Dan Skibins, who noted a dramatic decline in citizen complaints about a lack of police presence since starting the system.
Watch our webinar with the South Bend Police Department here.
ResourceRouter’s unique Community First approach has three protections in place to help establish impartiality when determining where patrols are conducted. First, the system intelligently meters out where patrol assignments occur and limits their duration to reduce instances of over-policing. Second, the system uses objective, non-crime data and purpose-built mechanisms to mitigate potential bias. Third, the system does not use any personally identifiable information to determine where patrols should be assigned.

ResourceRouter FAQs
Today’s law enforcement executives are facing budget and accountability pressures and need precision-policing tools to maximize their resource efficiency and promote more positive community engagement. ResourceRouter is a patrol and analyst tool that automates dynamic patrol location forecasts for all Part 1 crime data across an entire jurisdiction daily, enabling patrol and task force units to deter crime in a more precise and impactful way while also improving community engagement.
Better Information: Review dynamic patrol location forecasts, precise risk assessments. and pre-patrol briefings, facilitating optimal outcomes even with limited staffing and resources.
Better Decisions: Prevent crime and social disorder using the least amount of enforcement necessary and in partnership with the community.
Better Outcomes: Maximize crime deterrence and improve community relations by enabling command staff and line-level supervisors to apply the right dosage of policing in the right places at the right times.
ResourceRouter does not model misdemeanor or nuisance crimes that are more susceptible to enforcement bias. Specifically, it models the major crimes that have an outsized impact on the community:
- Part 1 Crimes: Gunfire, homicide, aggravated assault/battery, robbery, burglary, motor vehicle theft, and theft.
- ResourceRouter will not model crimes that are largely susceptible to enforcement bias.
- Yes, crime forecasts can be configured based on those crimes of interest to a police department. For larger agencies, each district or special enforcement unit may have their own crime type priorities and that can be easily accommodated.
- A separate risk model is created for each crime type enabling the technology to have a unique configuration for each agency and their jurisdictions that use it.
- However ResourceRouter will not model crimes that are largely susceptible to enforcement bias.
SoundThinking seeks to reduce crime with its solutions, but that capability alone is not enough to make a public safety solution of benefit to a community. The product must provide more benefit than harm. The company has incorporated technology and policy protections to mitigate bias and discrimination yet still yield a significant public safety benefit. These protections include:
- We use crime data that is least susceptible to bias – Our models only use data for crime types that are typically called in from the community and not driven by police presence. We exclude misdemeanor and nuisance crimes that can create negative feedback loops with enforcement bias. These loops can occur in other modeling approaches when police presence in an area can repeatedly return police to the same area.
- We supplement crime data modeling with non-crime data and exclude people data – We also work to reduce bias by supplementing reported data with multiple sources of relevant data from independent, open sources. Typical examples include seasonality, time of month, day of week, time of day, holidays, upcoming events, weather, and locations of liquor establishments.
- We maximize the reduction of harm – We do not make predictions about the actions of people – that means no arrests, social media, or personal data is used. We limit the time an officer patrols and the occurrence of patrol assignments in the same location to prevent over-patrolling.
- We prioritize oversight and accountability – We log data input used and outputs generated by each model. We also log patrol activities including time, place and tactics used.
- We are proactively transparent – We are committed to being transparent about how our system works and use third parties to provide objective assessments.
SoundThinking offers:
- ShotSpotter, an innovative gunshot detection technology that enables law enforcement to proactively address gun violence and arrive at a scene within minutes, saving lives and building community trust in the process.
- CrimeTracer, the #1 law enforcement search engine that enables investigators to search through more than 1.3B structured and unstructured data across jurisdictions to obtain immediate tactical leads, leverage advanced link analysis to make intelligent connections, link NIBIN leads to reports, suspects, and other entities, and more.
- CaseBuilder Crime Gun, the first-of-its-kind gun crime tracking and analysis case management tool that enables agencies to better capture, track, prioritize, analyze, and collaborate on incidents that involve firearms.
- ResourceRouter, is a resource management tool that automates the planning of directed patrols and provides transparency around engagement activities across an entire jurisdiction, daily.


