ResourceRouter™
Maximize Limited Patrol & Analyst Resources for Highest Impact
Automate Directed Patrol Planning to Better Serve Communities
Request A Consultation

The Impact of ResourceRouter (formerly Connect) to Police Agencies

-
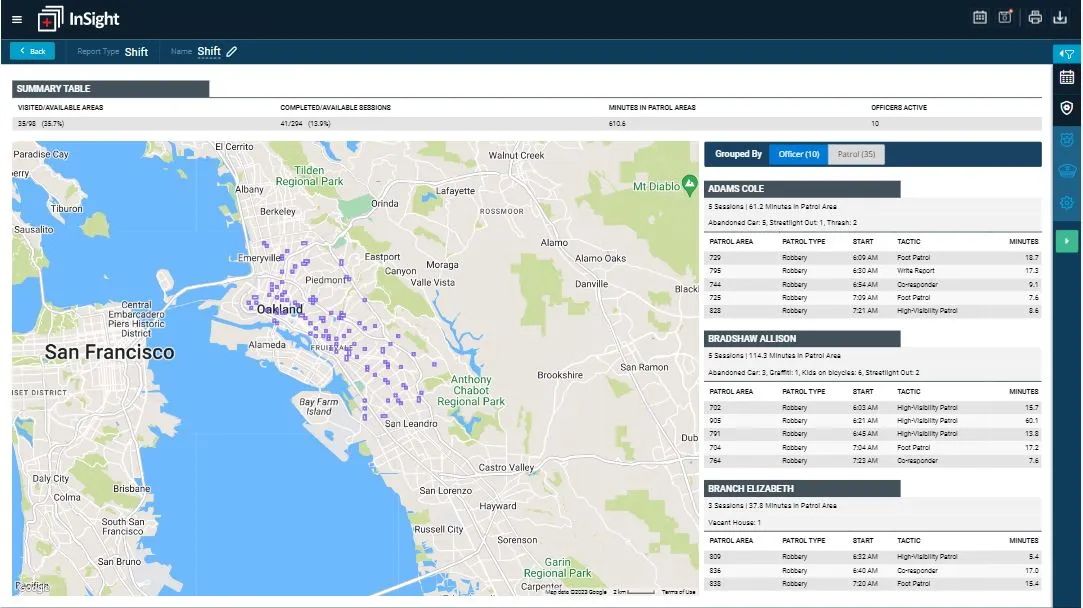
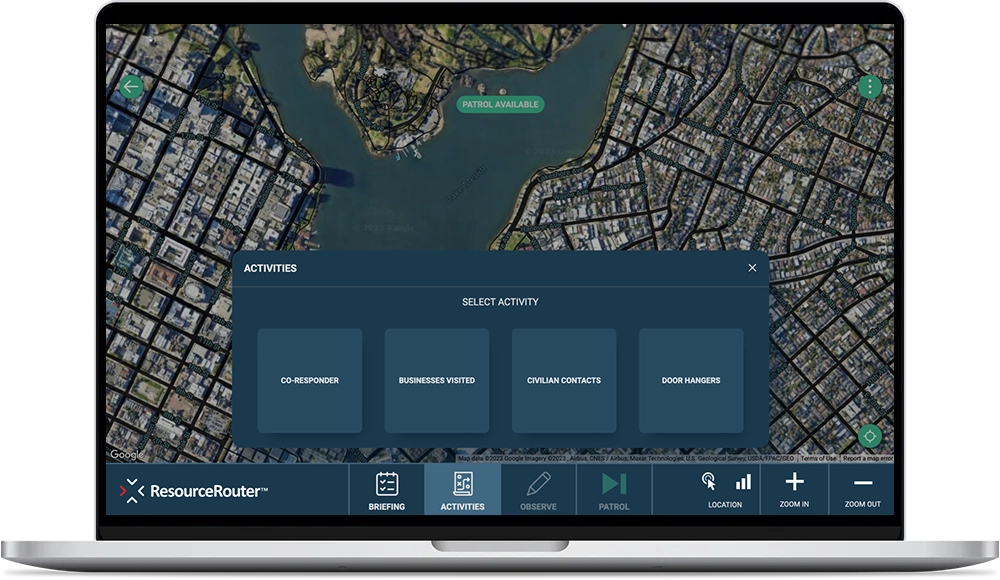
The Shift Report shows where officers were and what they were doing over time.
-
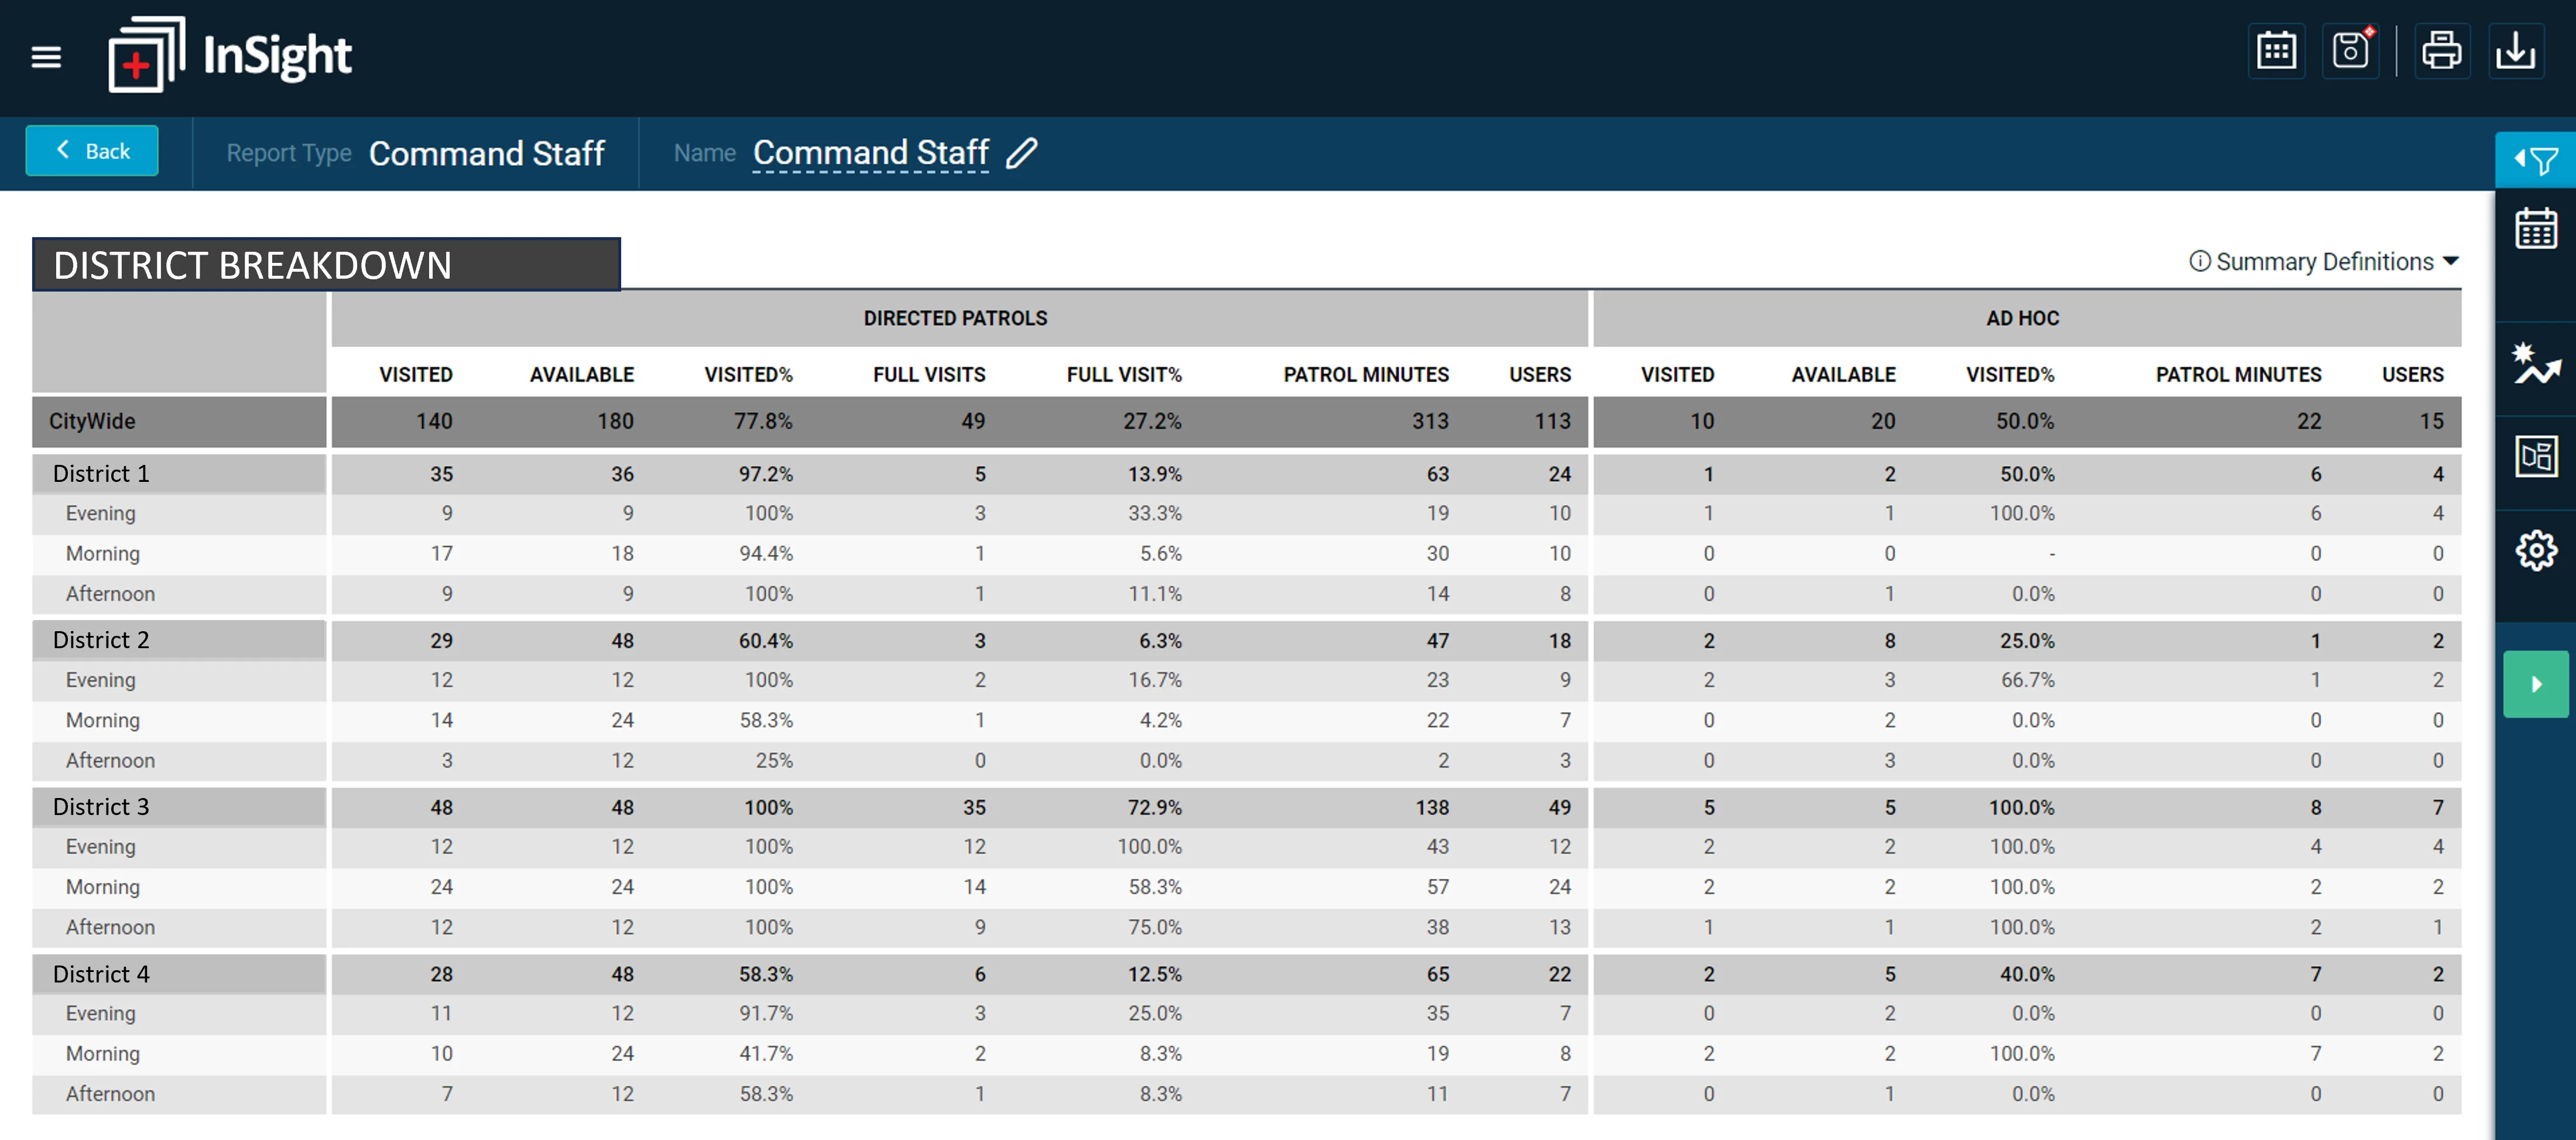
The Command Staff Report provides comparison metrics for directed patrol activity by area, risk forecast, and shift.
-
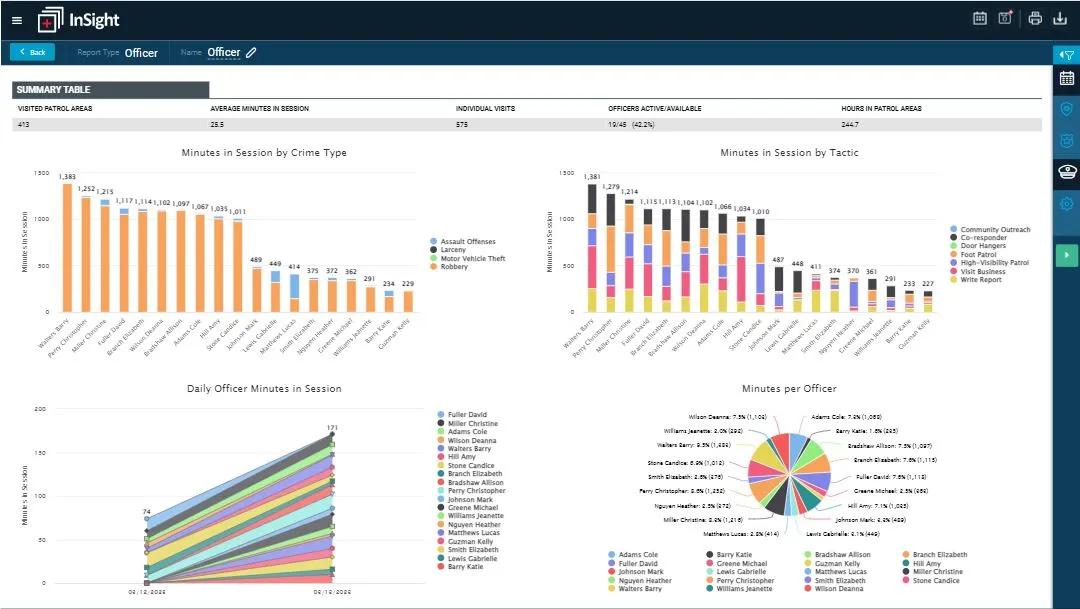
The Officer Report shows how time was spent on each tactic to hold officers accountable.
-
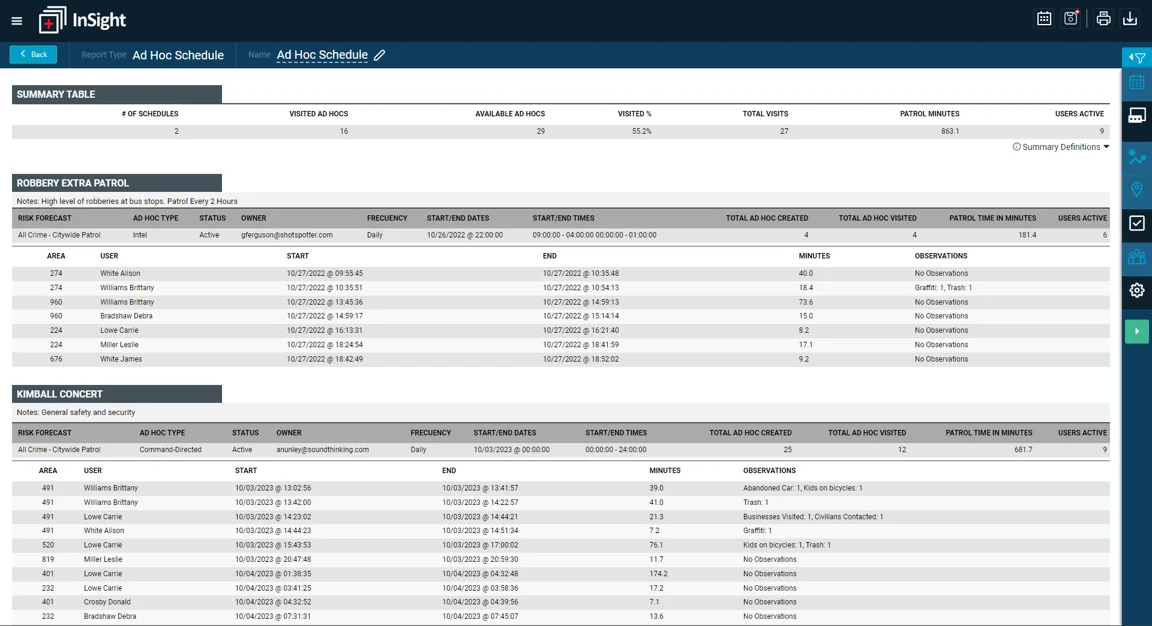
The Ad Hoc Schedule Report allows agencies to see officer activity for agency defined events such as a special auto theft detail or weekend parade event.
-
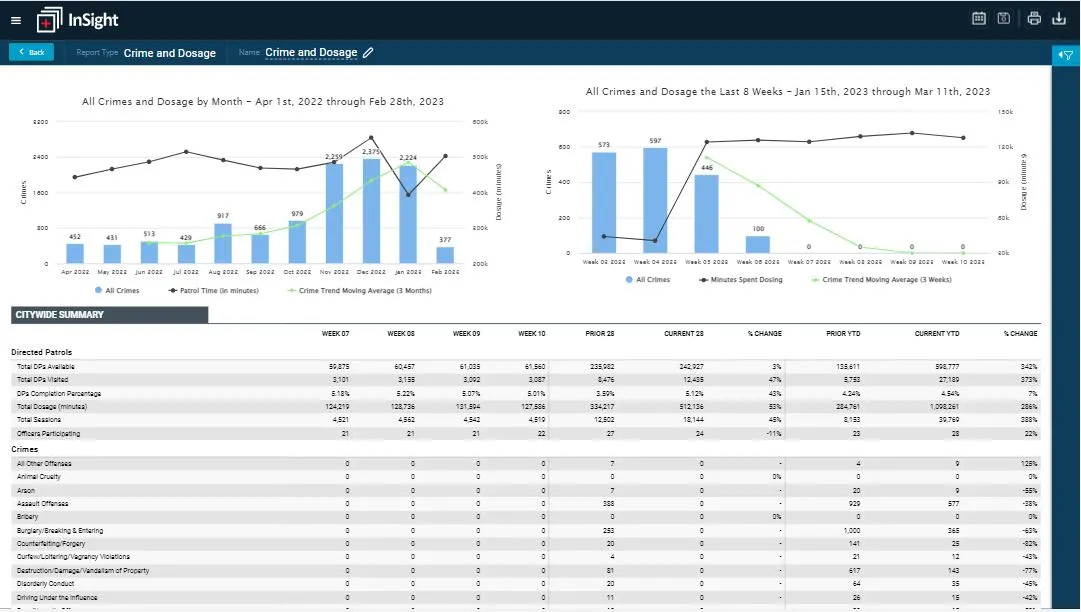
Title Crime and Dosage Report illustrates how directed patrols are impacting crime over time.